
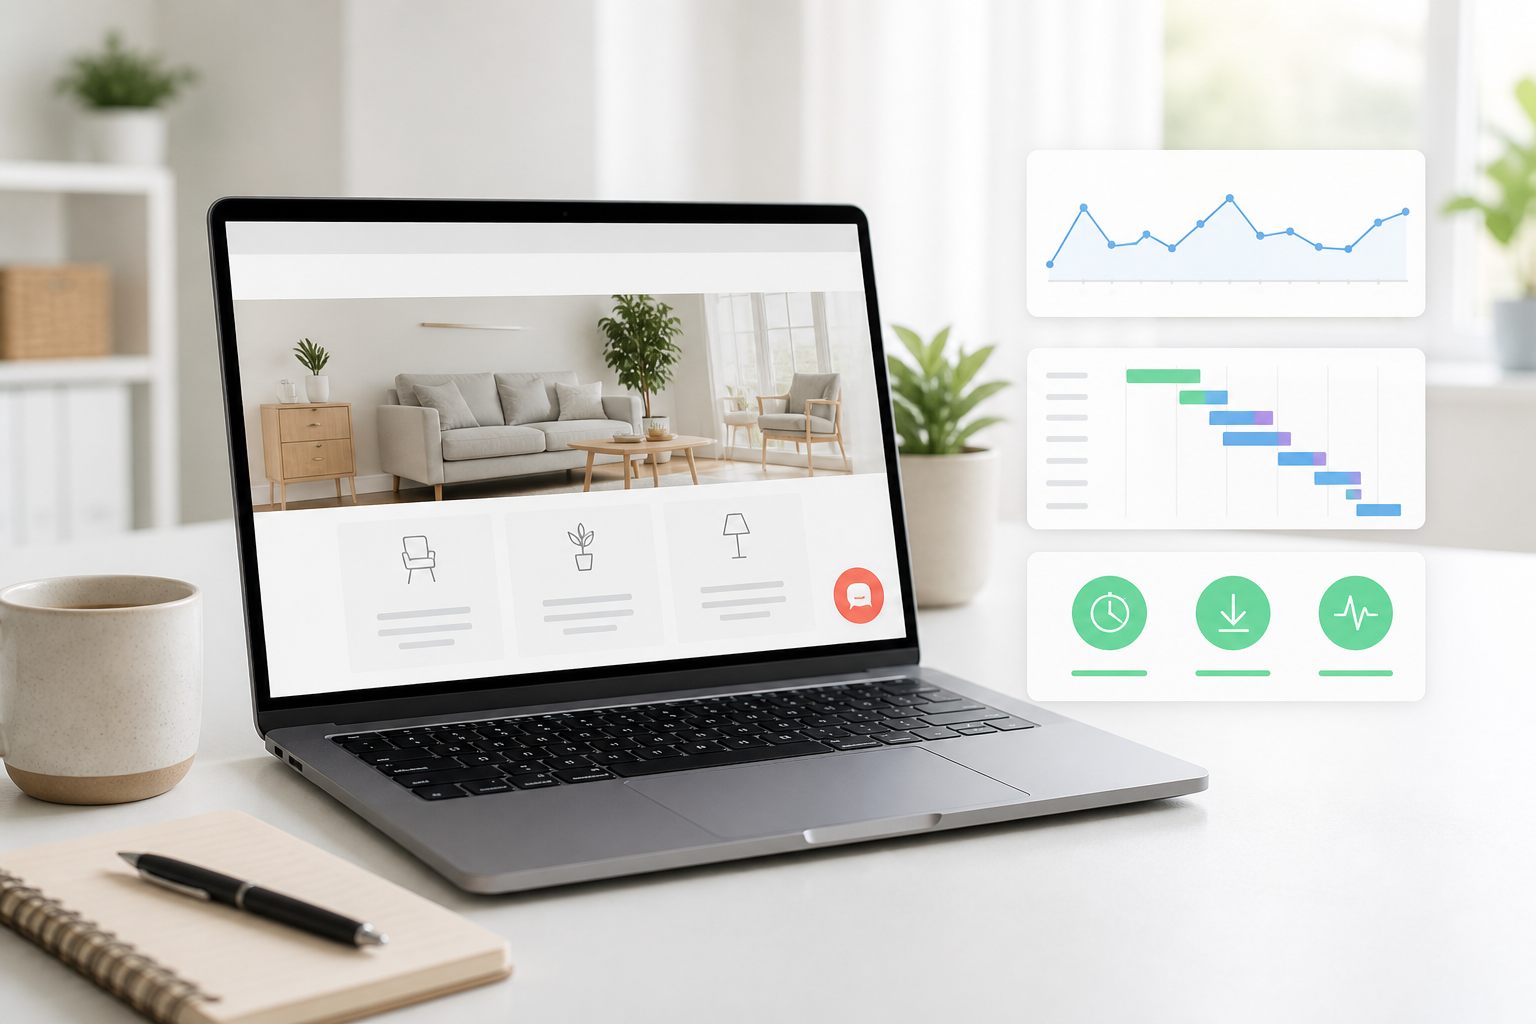
The short answer: measure the change, not the assumption
Any third-party feature can add network requests, JavaScript execution, and visual elements. A live chat widget is no exception. That does not mean every chat installation makes a site perceptibly slow, or that removing chat will fix a page that was already overloaded. The result depends on how the widget loads, the rest of the page, the visitor's device and network, caching, and whether the script was accidentally installed more than once.
Use a baseline-versus-widget comparison on the same pages under the same test conditions. Record what changed, then inspect the cause. A performance score by itself is a diagnostic clue, not a business verdict. The launcher also has to work: it should open promptly, accept typing, send messages, remain usable on mobile, and avoid covering important controls.
WordPress's own performance handbook lists hosting, configuration, software versions, themes, plugins, images, and file sizes among the factors that can affect a site. It recommends browser performance tools and selectively disabling plugins when diagnosing a slowdown. That is the right mindset for chat too: change one variable and verify the result.
Sources: WordPress Advanced Administration Handbook: Optimization
Measure the three Core Web Vitals that visitors feel
Google's current Core Web Vitals cover loading, responsiveness, and visual stability. Largest Contentful Paint (LCP) should be 2.5 seconds or less, Interaction to Next Paint (INP) should be 200 milliseconds or less, and Cumulative Layout Shift (CLS) should be 0.1 or less. Google evaluates the recommended targets at the 75th percentile of page loads, separated for mobile and desktop.
For a chat widget, watch all three but interpret them carefully. A launcher that appears late and pushes content can contribute to CLS. Heavy JavaScript that occupies the main thread can make interactions less responsive. A script that competes with a hero image or critical page resources may affect loading. The waterfall and performance trace help connect a changed metric to the responsible request or task.
Lab and field data answer different questions. Lighthouse and Chrome DevTools provide controlled diagnostics you can use immediately during a change. Real-user data reflects actual devices and connections over time. Google notes that Lighthouse cannot measure INP without real user input; it reports Total Blocking Time as a lab diagnostic instead. Use lab tests to catch regressions before release, then field data to confirm the visitor experience.
- LCP: when the largest visible content finishes rendering
- INP: how quickly the page responds across real user interactions
- CLS: how much visible content shifts unexpectedly
- TBT: a useful Lighthouse lab diagnostic for main-thread blocking, not a replacement for field INP
Sources: Google web.dev: Web Vitals · Google web.dev: Core Web Vitals workflows with Google tools
Create a clean WordPress baseline
Choose a small set of pages that represent real visits. Test the homepage, a content-heavy page, the contact page, and any important product, cart, or booking page. A WooCommerce site should include the storefront path customers actually use, although Yapdesk does not claim a direct WooCommerce data integration. Test mobile first because slower processors, narrower screens, and variable networks can expose problems hidden by a fast desktop computer.
If possible, work on staging configured like production. If production is the only realistic environment, test during a quiet period and avoid changing caches, themes, analytics tags, image optimization, or hosting at the same time. Run each page several times and keep a representative middle result. The repeated-run method is a practical way to reduce one-off noise; it is not an official pass rule.
Save the page URL, test date, mobile or desktop mode, LCP, CLS, TBT, transferred bytes, and request count. Note whether field data is available, but do not expect it to change immediately after installation. Your baseline is useful only if you can reproduce it after the widget is enabled.
- Open PageSpeed Insights or Lighthouse and select the first representative URL.
- Run the same mobile test three times without changing the site.
- Record the middle result and any repeated diagnostic warnings.
- Repeat for the other representative pages and desktop mode.
- Capture a screenshot or export the report so the baseline is not lost.
Install the chat widget exactly once
Connect WordPress using one supported method. With Yapdesk, install the plugin and enter the credentials for the correct connected website. Do not also paste the embed through the theme, a header-and-footer plugin, or a tag manager. Duplicate installation can create extra requests, duplicate launchers, conflicting state, and misleading performance results.
Publish the change, clear only the caches required by your normal deployment process, and inspect the public page while signed out of WordPress. Use a private browser window to avoid admin-bar code and stale local data. Confirm that one launcher appears and that it belongs to the intended connected website.
Core live chat and message mode are free with Yapdesk branding. AI-only and hybrid replies are Pro AI features. The performance test is the same whichever reply mode you use because visitors still need a stable, responsive widget experience.
Sources: Yapdesk guide: Connect WordPress to Yapdesk · Yapdesk guide: Customize the chat widget
Repeat the test and inspect what changed
Run the same URLs, modes, and number of tests used for the baseline. Compare the metrics, but also open the browser's Network and Performance tools. Filter requests by the widget host or script name, identify the initiator, and look at transfer size, request timing, and main-thread work. This tells you whether the widget changed the page or merely happened to be present when another resource varied.
Investigate consistent changes rather than a single unusual run. If LCP moves, check whether the LCP element itself changed and whether its image, font, server response, or rendering was delayed. If CLS rises, watch a recording to see what moved. If TBT rises repeatedly, inspect long tasks and their script attribution. If only one page regresses, compare what that page loads that the others do not.
Do not optimize for a perfect score while breaking support. A tiny launcher that loads but cannot be opened, typed into, or reached by keyboard is not a successful result. Performance, accessibility, and task completion belong in the same acceptance test.
- Confirm there is only one widget script and one launcher
- Compare request count and transferred bytes before and after
- Identify long tasks and the script responsible for them
- Watch for content movement when the launcher and panel appear
- Check whether the chat overlaps menus, cookie controls, checkout actions, or accessibility tools
Test the open chat, not only the closed launcher
Automated page-load reports usually see the closed launcher. Visitors interact with the open panel, so perform a second manual test. On a real phone or mobile emulation, load the page, scroll, open chat, focus the message field, type, send a marked test message, close the keyboard, and return to the page. Repeat with message mode if the site uses it after hours.
Look for delayed taps, missed input, page scroll trapped behind the panel, layout jumps, keyboard obstruction, and controls hidden below the viewport. Rotate the phone and try a narrow screen. On desktop, use the keyboard to reach the launcher, open it, move through controls, and close it without becoming trapped.
Also test consent and caching behavior. If a consent manager delays chat until permission is granted, verify both paths. If page caching differs for logged-in and logged-out visitors, the public visitor path is the important one. A dashboard preview cannot reveal every theme, optimization plugin, or storefront conflict on the published site.
Separate widget cost from existing WordPress bottlenecks
A slow result after adding chat does not prove chat caused the entire delay. WordPress highlights themes, plugins, images, hosting, software versions, caching, and file volume as performance factors. A large hero image can dominate LCP; a page builder or advertising tag can dominate JavaScript time; a slow server can delay the HTML before browser scripts begin.
Use attribution instead of guessing. Check the request initiator and script URL, compare pages, and disable one component at a time on staging. If the baseline was already poor, fix the largest measured bottleneck first and rerun the full comparison. Removing several plugins together may produce a faster page, but it will not tell you which change mattered.
Caching can reduce repeated server and file work, but it does not excuse duplicate scripts or an unusable interface. WordPress documents page, browser, object, and server caching as different layers. Make one documented change, purge the appropriate cache, verify the public response, and measure again.
A 30-minute live chat performance check
Use this checklist for a new installation and repeat it after theme, optimization, consent, or chat-plugin updates. Keep the reports with the deployment record so a future change can be compared with the same pages and conditions.
- Select four real visitor pages, including the most important mobile conversion path.
- Run and save three mobile baseline tests for each page.
- Install the Yapdesk WordPress plugin once with the correct website credentials.
- Verify one launcher on the signed-out public site.
- Repeat the same lab tests and compare representative results.
- Inspect network requests, long tasks, the LCP element, and layout shifts.
- Open chat on a phone, type and send a test message, and check scrolling and keyboard behavior.
- Test message mode, consent behavior, desktop keyboard access, and important page controls.
- Confirm the test conversation reaches the correct Yapdesk inbox.
- Review real-user Core Web Vitals over time and investigate consistent regressions.
Start with free live chat
Add Yapdesk to WordPress, answer visitors from one inbox, and use message mode when your team is away. Pro AI is available when you want an AI assistant trained on your business.